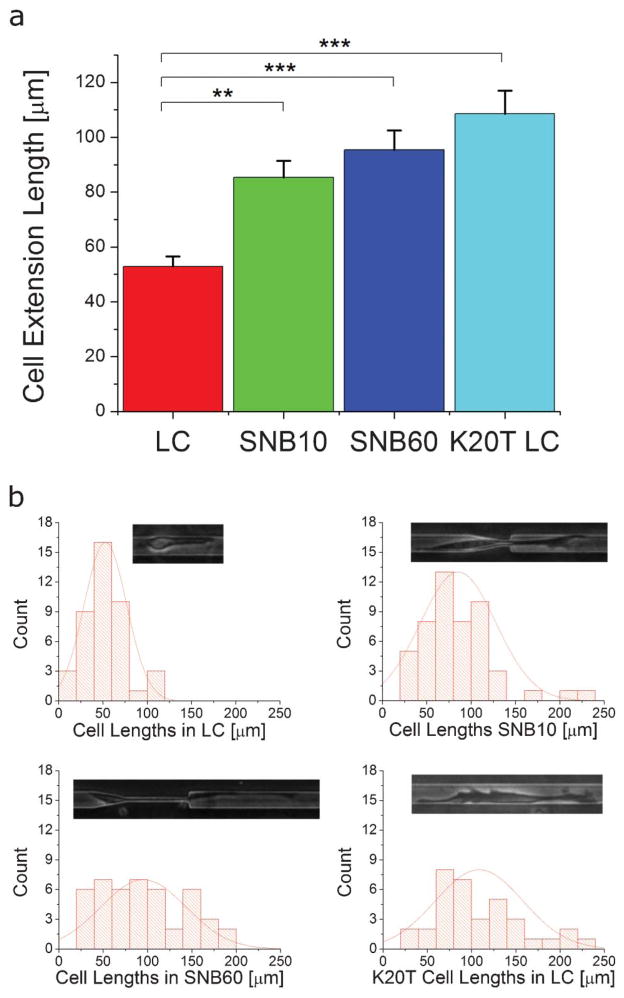
Fig. 5.
Cell extension lengths. a) The average cell extension length measured at a random point in time for MDA-MB-231 cells in the larger channel LC (53 μm, n = 42 cells), while interacting with SNB10 (85 μm, n = 50 cells), while interacting with SNB60 (95 μm, n = 45 cells), and K20T cells in the LC (109 μm, n = 35 cells). Extension lengths are measured from the center of the cell body to the end of the longest extension. The subnucleus barrier induces longer cell extensions and K20T cells also have longer cell extensions. ** represents p < 0.01 and *** represents p < 0.001 from ANOVA statistics. b) Histograms and typical cell morphologies at each scenario. The width of the larger channel is 15 μm.

