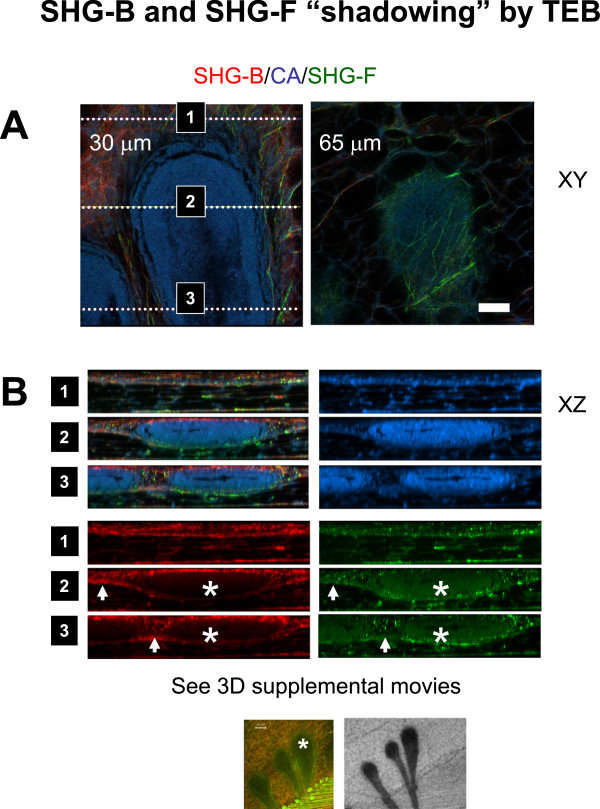
Figure 8.
TEBs are associated with linear configurations of collagen fibers. Using a GFP-mouse mammary gland from a 4.5 week old mouse (gland number 3), a TEB near the surface of the mammary gland was imaged to a depth of 98 μm using SHG-B and SHG-F together with Carmine Alum fluorescence. A, Linear arrays of collagen fibers were observed around and between TEBs (Z = 30, and Z = 65 μm). B. XZ line scan presentation of the results illustrates the shadowing of the SHG signals by the TEB (asterisks). 3D movies of the Z-stack from this and an adjacent view can be found in the Additional file (Additional file 6: Movies S4-5). Scale bar = 50 μm.

