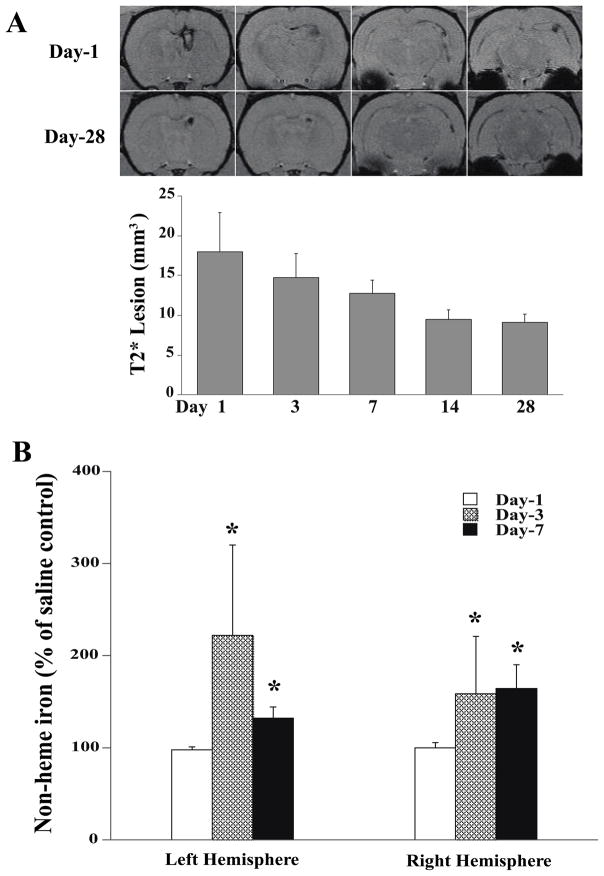
Figure 3.
(A) T2* weighted MRI scans (coronal sections) at day 1 and day 28 after IVH, and the time-course of the T2* lesion (hypodensity) after IVH. Values are expressed as the means ± S.D., n=7. (B) Time course of non-heme brain tissue iron in the left and right hemisphere after IVH. Values are mean ± S.D., n=6, *p<0.05 vs. saline control (same time point) and day 1. Figure reprinted with permission from Chen et al., Stroke 2011;42:465–470.

