Figure 1.

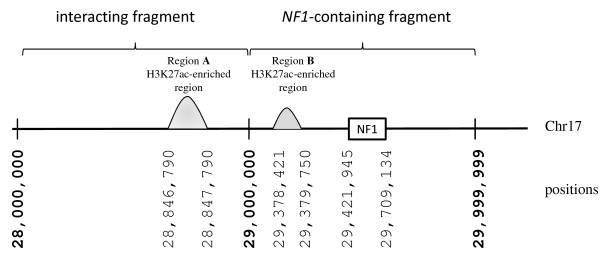
Schematic of the occurrence and level of H3K27ac enrichment within interacting and NF1-containing DNA fragments. The level of enrichment is shown by the height of the curves (not to scale).

Schematic of the occurrence and level of H3K27ac enrichment within interacting and NF1-containing DNA fragments. The level of enrichment is shown by the height of the curves (not to scale).