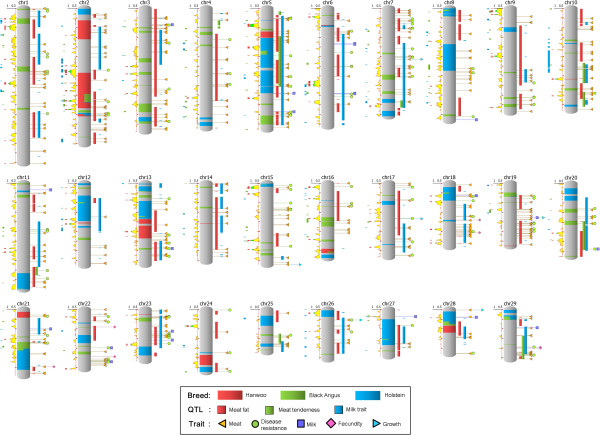
Figure 2.
Integrated ROH and QTL maps of Bos taurus chromosomes. NGS ROHs (ROH defined by the SNP derived from NGS) are positioned onto a chromosome image. The left side of a chromosome shows Chip ROH (ROH defined by the SNP derived from the SNP chip) information. The line chart at the left of a chromosome indicates the Hanwoo homozygosity ratio defined by the SNP chip; ratios from 0.5 to 0.8 are shaded in yellow and ratios >0.8 are shaded in green. The bars at the left of the line chart indicate the Chip ROH. The right side of a chromosome shows QTL and trait-associated genes. The bars at the right of a chromosome indicate the genomic positions of meat and milk-related QTLs. At the right of the QTL bars, five types of trait-associated genes point to their genomic locations.

