
Figure 2.
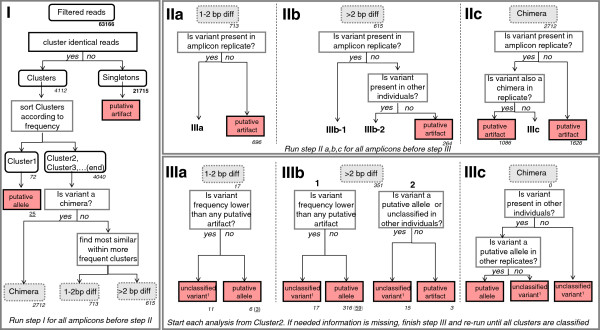
Allele and artefact identification workflow: pathway for identification of artefacts and putative alleles. Read numbers are given in bold, number of clusters are indicated in italics and the number of putative alleles is underlined. Note that putative alleles might be identified at different steps depending on the individual, explaining why the sum is larger than the total number of putative alleles observed in this study. Dashed gray rectangles indicate intra-amplicon cluster classifications (‘chimera’, ‘1-2 bp diff’, ‘> 2 bp diff’). Final cluster identification is highlighted in red. Unclassified variants1 include those neither classified as ‘putative artefacts’ nor as ‘putative alleles’ because they either appeared in a single amplicon or their frequencies were not above all artefacts. A detailed description of the workflow steps (I to III) is provided in the Method section.