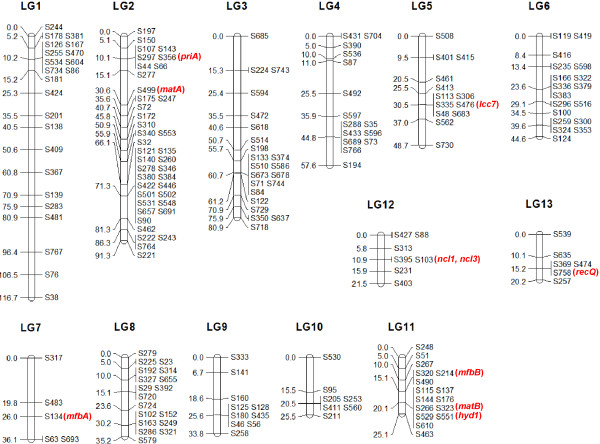
Figure 1.
Genetic linkage map of L. edodes. The map was constructed using 20 SSIs. Linkage group numbers were indicated on the top, distances between markers (in cM) were shown on the left and the markers named according to the scaffolds were shown on the right. Genes discussed in the text were marked in red and placed next to the scaffold markers on which they resided.

