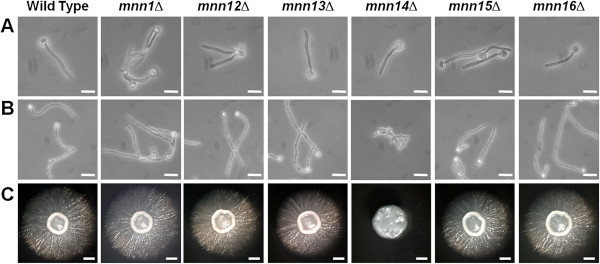
Figure 2.

Cell and colony morphology of MNN1 family mutants. Cell morphology after growth at 37°C in 20% serum for 4 h (A) and at 37°C in Lee’s at pH6.5 for 6 h (B). Scale bar, 10 μm. (C) Colony morphology after 6 days growth at 30°C on solid Spider medium. Scale bar, 1 mm.
