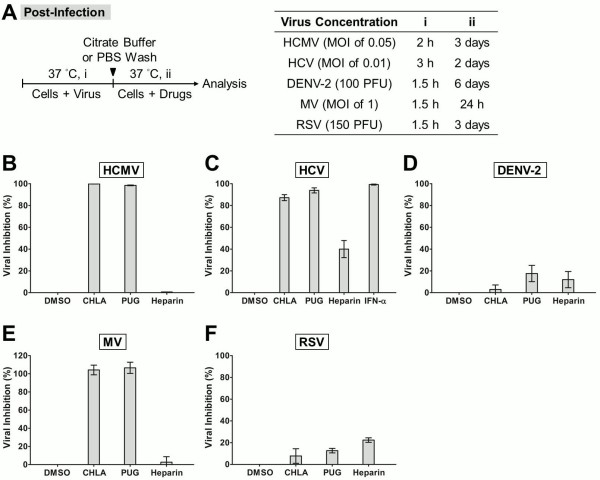
Figure 6.
Post-infection analysis of antiviral effects due to CHLA and PUG. Cell monolayers were inoculated with the respective viruses at 37°C to allow viral entry, then washed by citrate buffer or PBS to remove extracellular viruses, and subsequently incubated in the presence or absence of the test compounds for infection analysis. (A) Schematic of the experiment (left) with the virus concentration (PFU/well or MOI), virus infection time (i), and test compound treatment period post-infection (ii) indicated for each virus in the table shown on the right. Results for (B) HCMV, (C) HCV, (D) DENV-2, (E) MV, and (F) RSV are indicated in each additional panel. IFN-α treatment was included as control for HCV infection. Data shown are means ± SEM from three independent experiments. See text for details.

