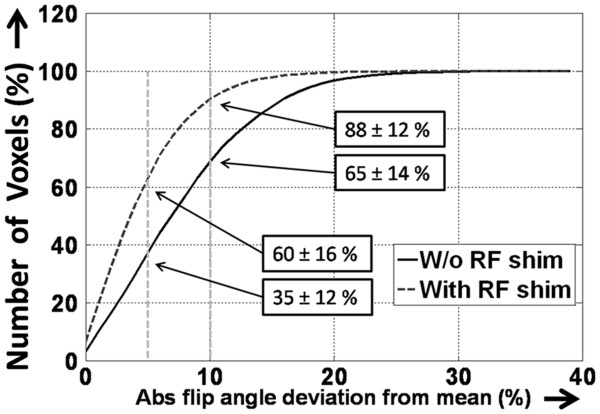
Figure 6.
Cumulative histogram plottingthe total number of voxels that fall within a given range from the mean flip angle in the selected region of interest (ROI). The dotted vertical lines indicate the ± 5% and ± 10% limits. In the case of subject-specific local radiofrequency (RF) shimming, 88 ± 12% of the voxels inside the ROI fall within ± 10% of the mean value. This value decreases significantly when no RF shim is used. Abs, absolute; W/o, without.

