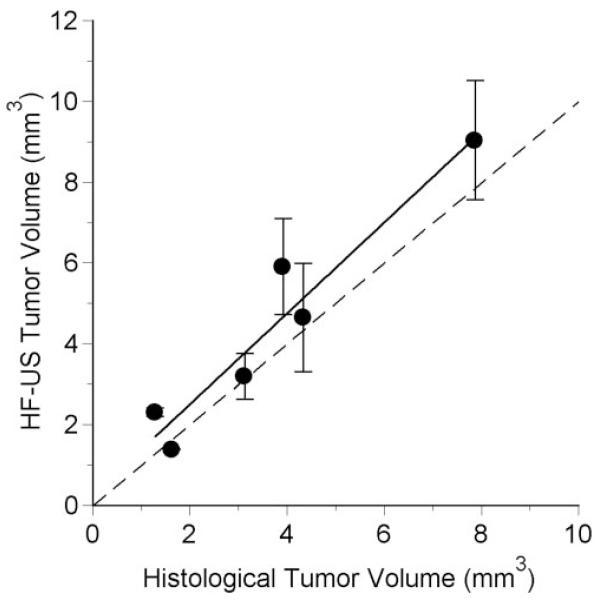
Figure 5.
Volume determined from HF-US images as a function of the corresponding volume estimated from histologic sections. Error bars show the standard deviations for measurements from 2 to 5 image series. The dashed line is the identity line. The solid line is the regression line: HF-US volume (mm3) = 1.126 (histologic volume) + 0.255, r2 = 0.923, n = 6, P = 0.002.

