
Fig. 3.
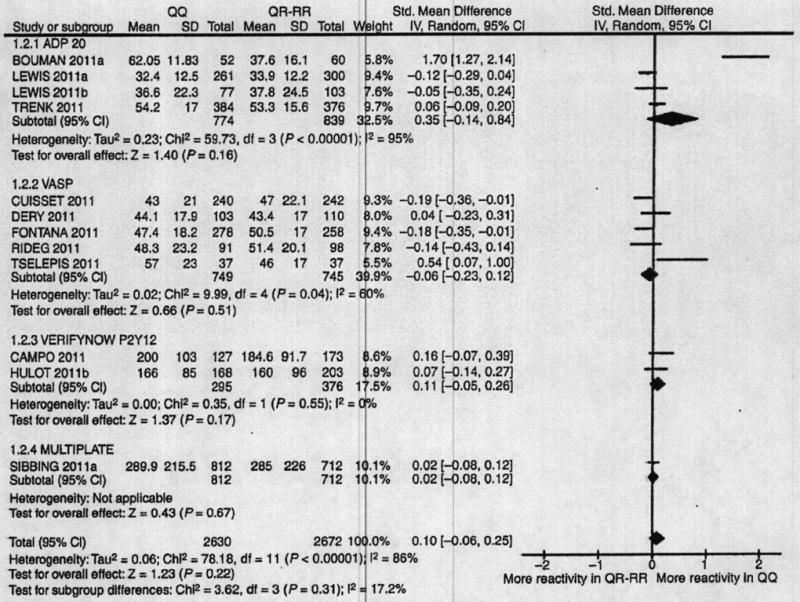
PON1-Q192R and platelet reactivity. The standardized mean differences in the platelet reactivity assay results between PON1 192QQ and 192QR + RR patients are shown. The analysis is stratified by the types of assays. The size of the squares corresponds to the weight of the study in the meta-analysis. Horizontal lines represent corresponding 95% confidence intervals (CIs). The global standardized mean differences are depicted as black diamonds.