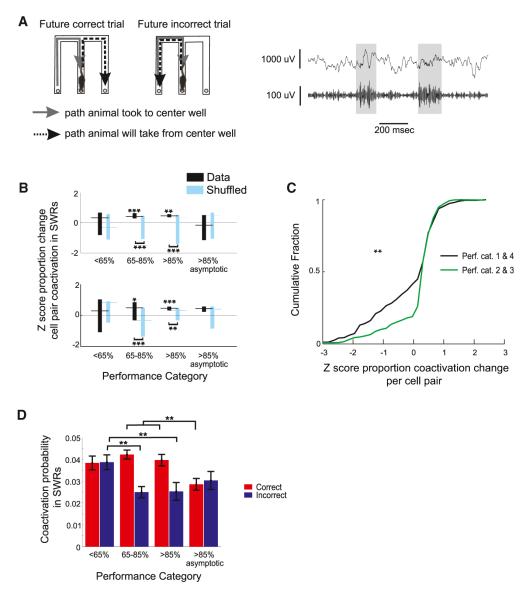
Figure 2. SWR Coactivity Is Enhanced Preceding Correct Trials during Task Acquisition.
(A) Left: diagram of one set of possible future correct and incorrect trials. Examples of SWRs (gray bars) in the raw LFP (top) and the LFP filtered for 150–250 Hz (bottom) when the animal was at the center well are shown.
(B) Z score for the difference in proportion of SWRs in which each cell pair was active preceding correct and incorrect trials across the following performance categories: 1, the first session in which the animal performed at <65% correct; 2, the first session 65%–85% correct; 3, the first session >85% correct; and 4, the first of subsequent sessions >85% correct. Bar indicates upper and lower quartiles, and horizontal line shows median for T1 (top) and T2 (bottom).
(C) Z score for the difference in proportion of SWRs in which each cell pair was active preceding correct and incorrect trials for performance categories 2 and 3 (green) and 1 and 4 (black).
(D) Coactivation probability per cell pair during SWRs preceding incorrect (blue) and correct (red) trials for performance categories 1 through 4, combined across T1 and T2. See also Figure S1 and Table S1. *p < 0.01, **p < 0.001, ***p < 0.0001.

