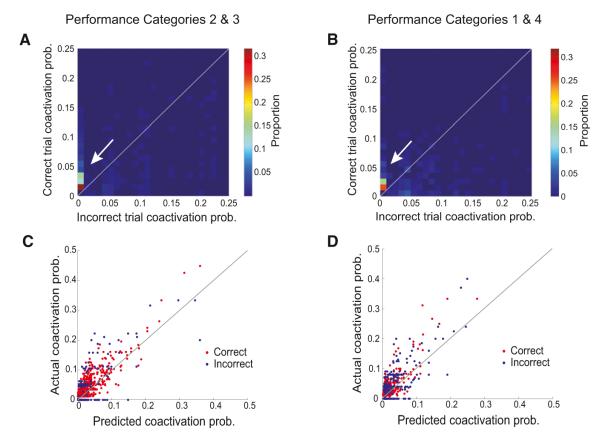
Figure 3. Differences in SWR Coactivity across Correct and Incorrect Trials.
(A) Two-dimensional histogram showing the proportion of cell pairs with different values of correct versus incorrect coactivation probability for performance categories 2 and 3 (65%–85% and >85% correct). The histogram is truncated at 0.25 on each axis for visibility but includes 99.0% of the data. The color scale indicates the proportion of cell pairs in each bin of the histogram. The white arrow highlights the preponderance of probability mass along the y axis, corresponding to pairs that were inactive or minimally coactive on incorrect trials.
(B) Same as in (A) but for performance categories 1 and 4 (<65% correct and >85% correct asymptotic). The histogram is truncated at 0.25 on each axis for visibility but includes 98.8% of the data. A smaller proportion of the probability mass is located along the y axis (highlighted by the white arrow) as compared to the histogram for performance categories 2 and 3 (A).
(C and D) Expected versus actual coactivation probability per cell pair during SWRs preceding correct (red) and incorrect (blue) trials for performance categories 2 and 3 (C) and for performance categories 1 and 4 (D). Note that there are the same numbers of correct and incorrect data points in each plot but for performance categories 2 and 3, most of these incorrect data points lie on the x axis.

