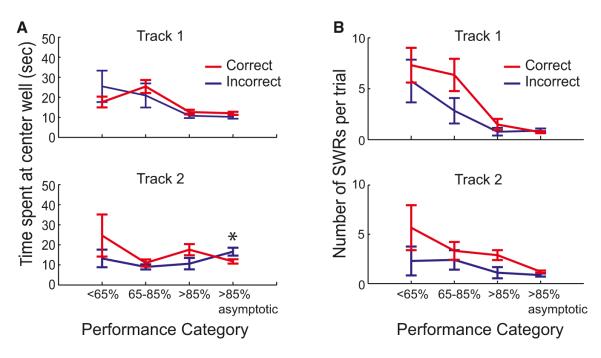
Figure 5. Similar Time Spent at Well and Number of SWRs Preceding Correct and Incorrect Trials.
(A) Time spent at the center well preceding correct and incorrect trials for T1 (top) and T2 (bottom).
(B) Number of SWRs preceding outbound trajectories across performance categories for T1 (top) and T2 (bottom). Only trials in which at least one SWR met criteria for analysis were included. *p < 0.01. See also Figure S1.

