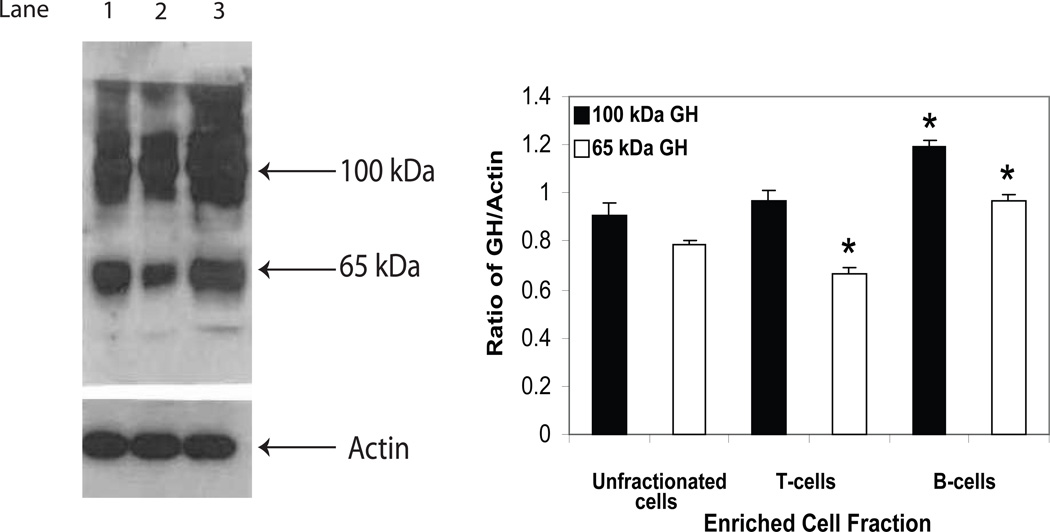
Fig. 2.
GH protein expression in primary mouse spleen, mouse T, and mouse B cells. Whole cell extracts were prepared from unfractionated spleen cells and nylon column purified T and B cells as described in the methods. After SDS-PAGE (8%) and transfer to PVDF membranes, Western blot analysis was performed using commercial Ab to GH (Santa Cruz) and bands visualized using a chemiluminenscence substrate for HRP (GE Healthcare). The approximate molecular weight for isoforms of GH are shown with arrows on the right. Key: Lane 1 (unfractionated spleen cells); lane 2 (T cells); lane 3 (B cells). The results shown above are typical of an experiment repeated 5 times (*p<0.05).

