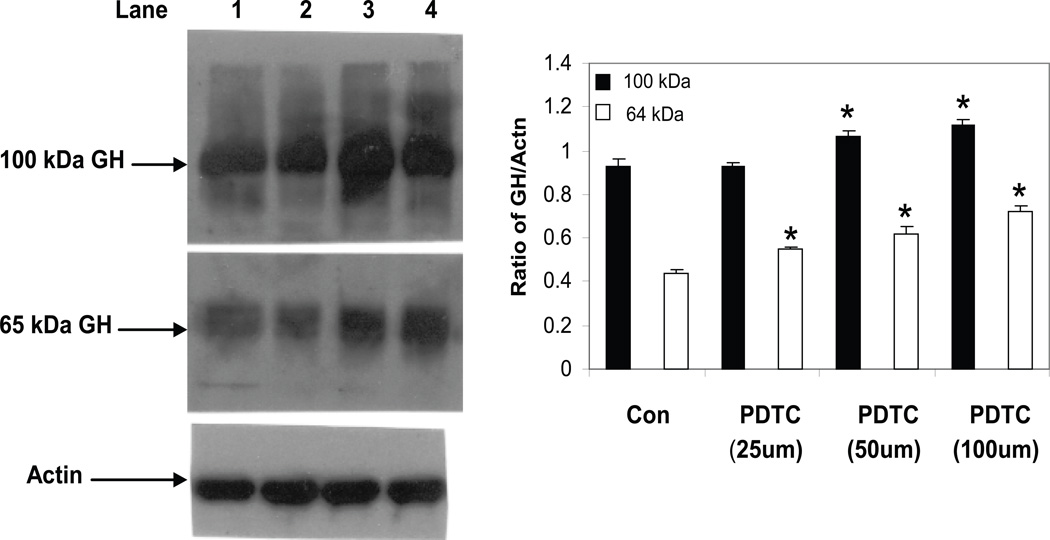
Fig. 6.
GH protein expression in mouse spleen cells treated with PDTC. Cells were treated for 16 hrs with different doses of PDTC after which whole cell extracts were prepared as described in the methods. After SDS-PAGE (8%) and transfer to PVDF membranes, Western blot analysis was performed using commercial Ab to GH (Santa Cruz) and bands visualized using a chemiluminence substrate for HRP. Blots were stripped and reprobed with specific Abs to actin. Asterisks (*) denote a significant difference (p<0.05) from control GH isoforms. The results shown are typical of an experiment repeated 3 times. Key: Lane 1 (nontreated control); lane 2 (PDTC, 25 µM); lane 3 (PDTC, 50 µM); lane 4 (PDTC, 100 µM).

