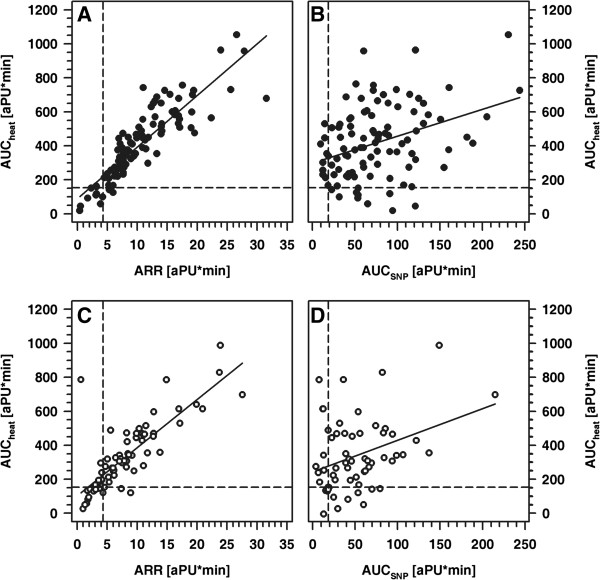
Figure 4.
Correlation between AUCheat and AAR (A, C) and between AUCheat and AUCSNP (B, D) in healthy children (A, B) and patients (C, D). A: r= 0.92, p<0.001; B: r=0.37, p<0.001; C: r=0.80, p<0.001; D: r=0.32, p<0.05; per parameter the 10th percentile is indicated by a horizontal or vertical line, respectively.

