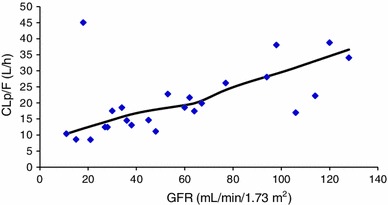
Fig. 2.

Relationship between CLP/F and GFR. The line represents regression calculated by statistical regression analysis. An outlier can be observed with high CLP/F and low GFR values. It is likely that the apparently elevated CLP/F value was due to a low bilastine bioavailability. The regression analysis was repeated with and without this outlier and similar results were obtained. r = 0.515; p < 0.01. CLP/F bilastine plasma clearance after oral administration, GFR glomerular filtration rate, p probability of a 22 degrees of freedom that it is due to chance, r Pearson’s r between non-compartmental analysis estimated using CLP/F and GFR
