
Fig. 1.
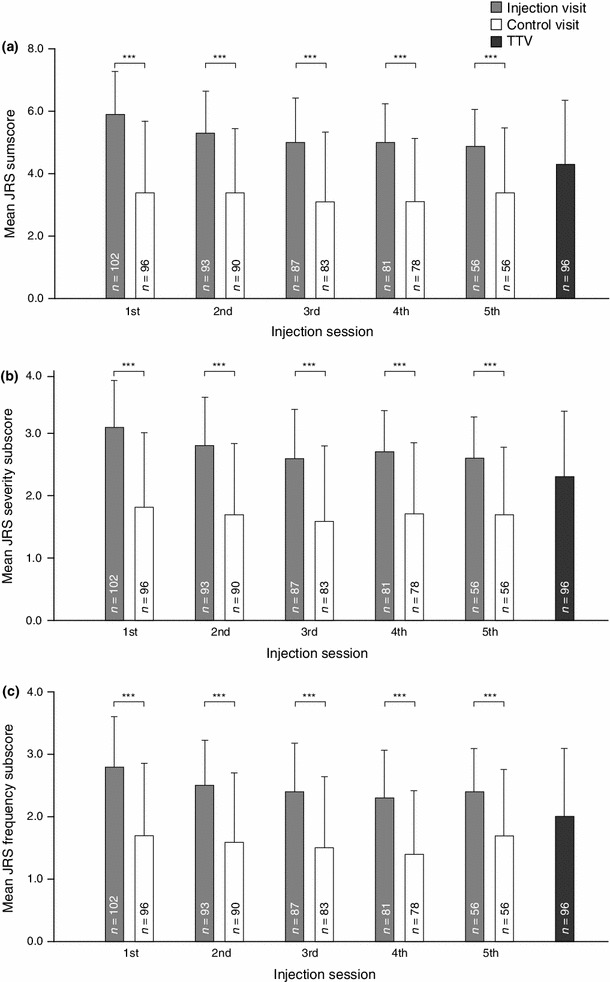
Mean JRS sumscore (a), severity subscore (b), and frequency subscore (c) at injection visits, control visits 6 weeks following injection visits, and the TTV (ITT population). ITT intent-to-treat, JRS Jankovic Rating Scale, TTV trial termination visit ***p < 0.001, one-sample t test, for the change from the injection visit to the respective control visit 6 weeks later (calculated only for subjects who attended both the injection and the respective control visit). Error bars represent the standard deviation. The TTV took place between 6 and 20 weeks after the last injection visit