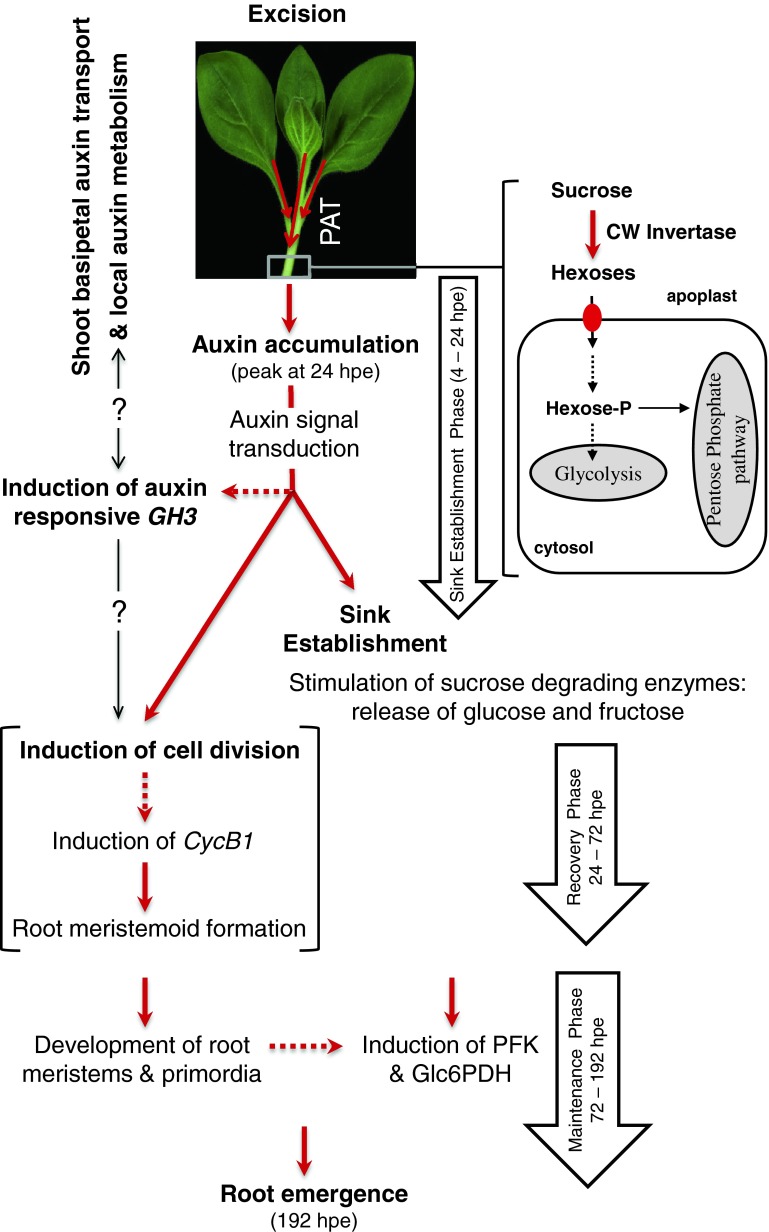
Fig. 9.
A postulated model of relationship between PAT, auxin accumulation, primary metabolism and AR formation in Petunia cuttings in response to excision from the donor plant. Red solid arrows indicate processes that are dependent on PAT and are correlated with the resulting auxin peak at 24 hpe in the rooting zone. Red dashed arrows indicate additional processes which are hypothetically depending on PAT as supported by data of the present study and of Ahkami et al. (2009). Thin black arrows with question mark show possible interrelations between GH3 induction, auxin metabolism and cellular events of AR formation. Further details regarding different stages and phases of AR formation in petunia cuttings are described in Ahkami et al. (2009). PAT polar auxin transport, CW invertase cell wall invertase, PFK phosphofructokinase, Glc6PDH glucose-6-phosphate dehydrogenase, hpe hours post excision

