
Figure 7.
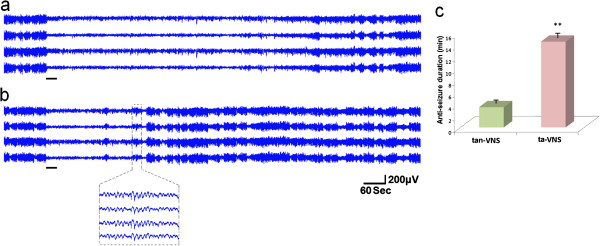
Representative FP tracing of the cortex in one rat. (a) ta-VNS. (b) tan-VNS. Stimulations are indicated by horizontal bars. (c) Comparison of the anticonvulsant duration between ta-VNS and tan-VNS. **: P < 0.01, vs. tan-VNS, n=12 per group.