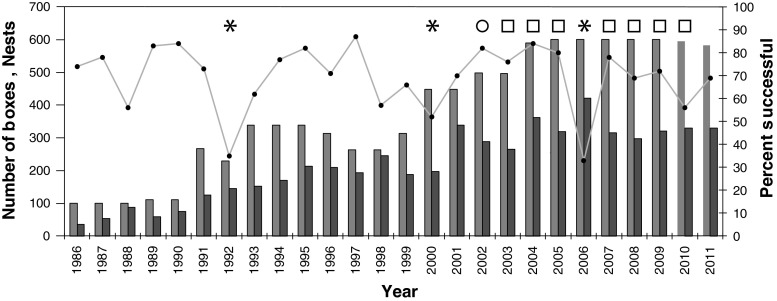
Fig. 1.
The number of available boxes (green bar) for nesting tree swallows (Tachycineta bicolor) around Ithaca, New York, from 1986 to 2011, the number of boxes used for nesting (orange bar), and the percentage of nests that successfully produced at least one fledgling (solid line). Asterisks indicate years of high brood mortality and circle for 1 year of normal brood survival for comparison, all used for individual chick-level mortality analyses in this paper. These years, plus years indicated with squares, were pooled for a brood-level analysis of cold snap effects (for details see text) (color figure online)

