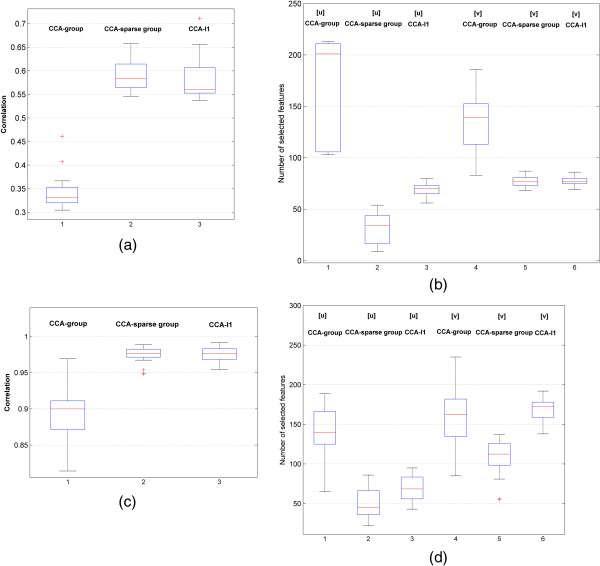
Figure 5.
The correlations and the features obtained by three sCCA methods based on 30 permutations of subjects. (a). The comparison of estimated correlations in glioma data; (b). The comparison of number of selected feature in glioma data; (c). The correlation comparison in NCI60 data; and (d) the feature selection comparison in NCI60 data (follow the same as (a) and (b)).

