
Figure 6.
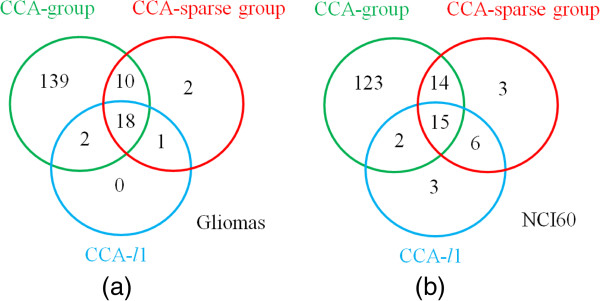
A comparison of the number of selected features with high frequency 20 out of 30 from the first canonical variate by three sCCA methods in the gliomas data (a) and the NCI60 data (b).
Official websites use .gov
A
.gov website belongs to an official
government organization in the United States.
Secure .gov websites use HTTPS
A lock (
) or https:// means you've safely
connected to the .gov website. Share sensitive
information only on official, secure websites.
A comparison of the number of selected features with high frequency 20 out of 30 from the first canonical variate by three sCCA methods in the gliomas data (a) and the NCI60 data (b).