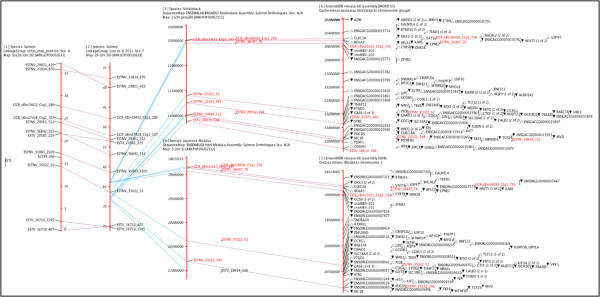
Figure 3.
Composite screen shot of ArkMAP detailing a mapping analysis of low quality Salmon data. Map 1 is a private (and obfuscated) salmon QTL linkage map (Houston RD, Gonen S: per.comm.) which uses SNP markers shared on published linkage map of salmon chromosome 26 (map 2 [25]). The best BlastX hits for sequences flanking the salmon SNPS were mapped as ‘orthologous sequences’ on the stickleback (map 3) and medaka (map 4) genome assemblies. These maps were then projected onto the gene annotated assemblies downloaded from Ensembl (maps 5 and 6). The figure is a composite screenshot from ArkMAP showing ‘Identity’ relationships in purple and ‘Synonymy’ relationships in blue (key as in Figure 1).

