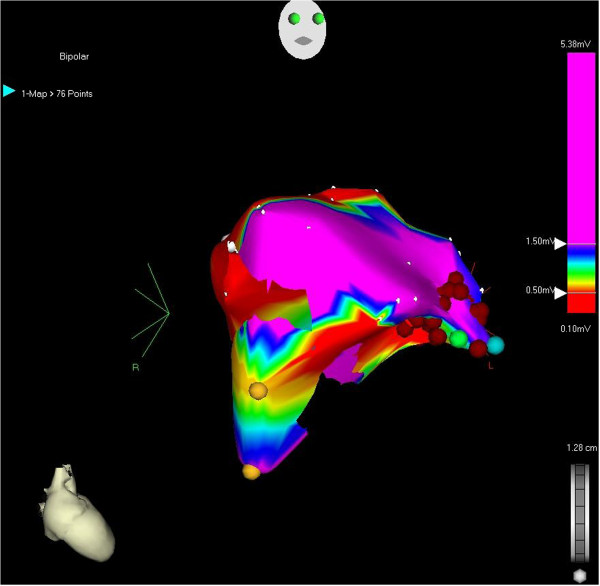
Figure 2.
Low density, simplified electroanatomical mapping of RVOT (52 points). Yellow dot represent His position. Blue dot represent position of catheter where VT was located. Green dot represent point where PVC stopped and red dots represent additional bonus applications. Red area shows low voltage area (<1.5 mV).

