
Figure 5.
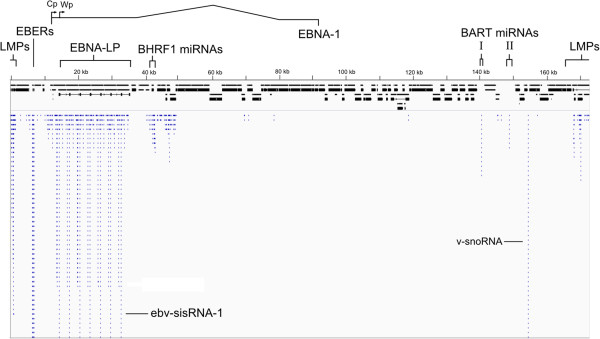
Small RNA library RNA-Seq reads aligned with the EBV genome. Reads are colored blue; the EBER1, EBER2, and sisRNA peaks are much larger than the represented area (see Table 1). A cartoon of the EBV genome is shown in black (exons as boxes and introns as thin lines). The locations of latently expressed genes [EBNA-LP, LMPs, EBERs (EBER1 and EBER2), BHRF1 miRNAs, and BART miRNAs (clusters I and II)] are indicated at the top of the figure, including the location of the Cp and first Wp promoter sites for producing mRNA for the EBNA-LP and five other EBNA proteins (additional details are in Figure 3). Peaks for the ebv-sisRNA-1 and v-snoRNA are indicated. Images were generated using the integrated genome viewer (IGV, [76,77]) with data from Additional file 5.