
Figure 1. Phylogeny of the PNP genes.
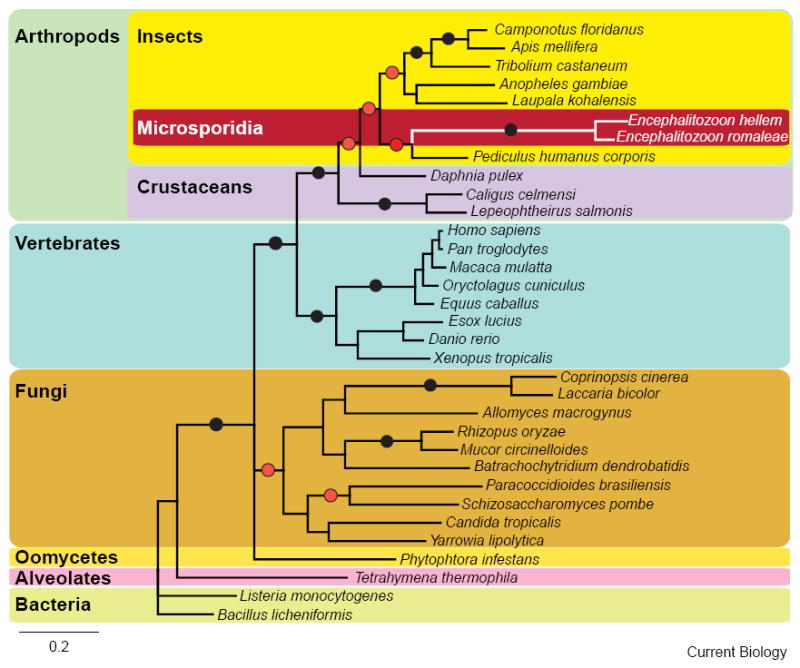
Phylogenetic relationships between the PNP genes based on 240 amino acid positions from a broad diversity of eukaryotes and prokaryotes. Major lineages are indicated by coloured boxes, while black circles indicate branches with bootstrap support of over 95% from Maximum likelihood analyses (WAG model of evolution) and over 0.95 posterior probabilities obtained using Mr Bayes (WAG model of evolution) and Phylobayes (CAT and LG models of evolution). Red circles indicate branches with posterior probabilities of 1 using Mr Bayes, but with bootstrap support and posterior probabilities sometimes below 95% and 0.95 for, either, maximum likelihood analyses, or for Bayesian analyses performed under the CAT and LG models of evolution implemented in Phylobayes. Phylogenetic relationships between the PNP genes of several eukaryotic and prokaryotic lineages based on 240 amino acid positions after removal of sequences corresponding to Pediculus humanus and Crustaceans (i.e. the longest branches) are shown in Figure S1.