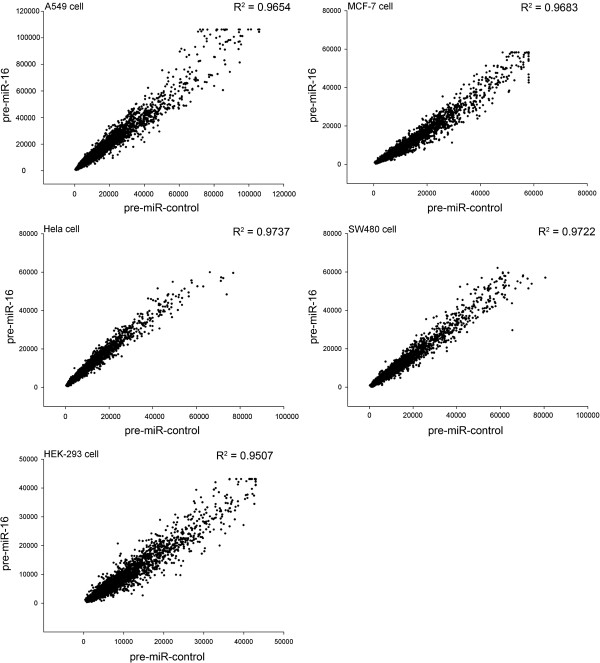
Figure 1.
Scatter plots showing mRNA expression in pre-miR-16-transfected cells versus control cells. A549, MCF-7, HeLa, SW480 and HEK-293 cells were seeded on 60-mm dishes and transfected the following day with Lipofectamine 2000. For each well, 200 pmol of pre-miR-16 or pre-miR-control were added. At 24 h post-transfection, mRNA from these cells was subjected to microarray analysis.

