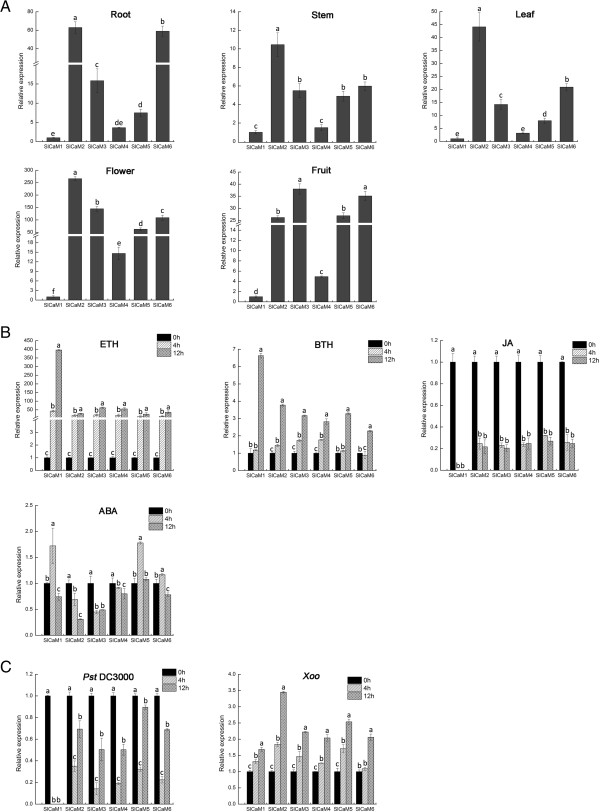
Figure 5.
Expression profiles of the SlCaM genes in plants. Gene expression was analyzed by qRT-PCR. Expression levels relative to SlCaM1 (A) and 0 h time-point (B, C) is shown. Significant difference between expression values within the target genes is indicated as different lowercase letters (P <0.05, DMRT). (A) Expression in different organs. (B) Expression in response to different hormone treatments. (C) Expression in response to pathogen inoculation with Pst DC3000 and Xoo.

