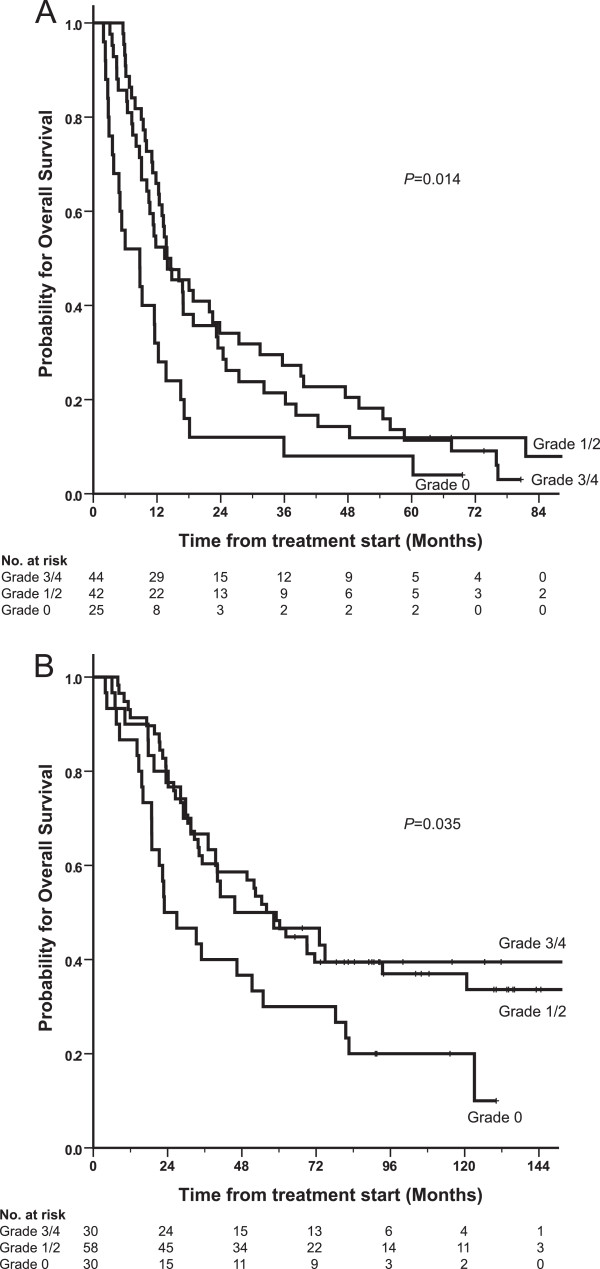
Figure 1.
Kaplan-Meier plot of overall survival for NSCLC patients (A) (N = 111) and ovarian cancer patients (B) (N = 118) stratified for neutropenia grade at nadir. Grade 0, neutrophils ≥ LLN; grade 1, neutrophils < LLN to 1.5 × 10⁹/L; grade 2, <1.5 - 1.0 × 10⁹/L; grade 3, <1.0 – 0.5 × 10⁹/L; grade 4, < 0.5 × 10⁹/L. P-values obtained from log-rank test.

