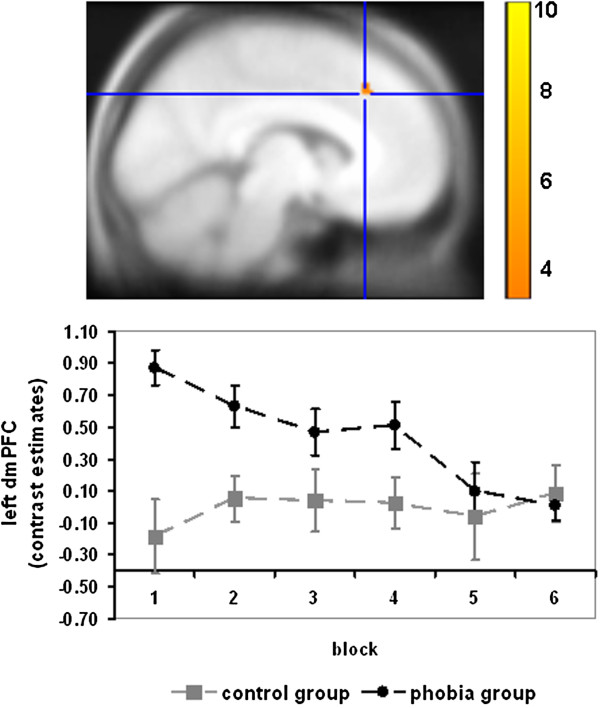
Figure 1.

Stronger activation decrease in the left dmPFC (MNI coordinate: -6, 29, 40; marginally significant: pfwe = .058) for phobic vs. neutral pictures in the phobia group compared with the control group. For illustration purposes, contrast estimates were averaged across 5 consecutive trials, respectively, resulting in 6 blocks for 30 trials. Color bar indicates T-values; for illustration reasons, data were thresholded at p < .001 and superimposed on the MNI305-T1 template.
