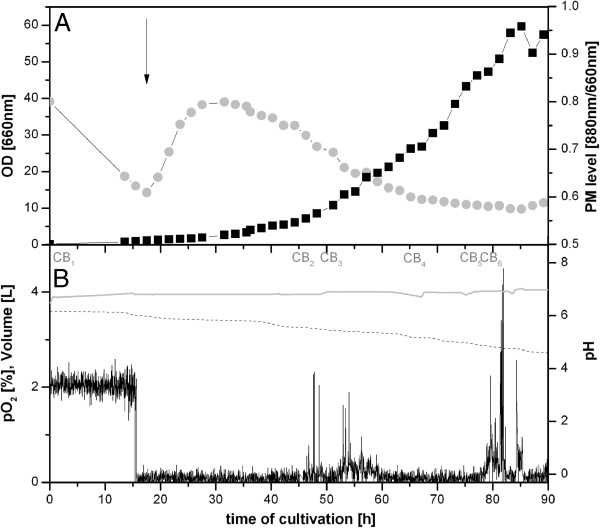
Figure 1.
Microaerobic Fed-Batch HCD cultivation of R. rubrum. A: OD (660 nm, ■) and PM levels (880/660 nm, gray circle symbol). Time points where samples were taken for further cultivation experiments are indicated as culture broth (CB1-6). B: pH (gray line), partial oxygen tension pO2 (—) and total culture volume (− −). The shift in oxygen availability was induced at 15 hours, indicated by the arrow.

