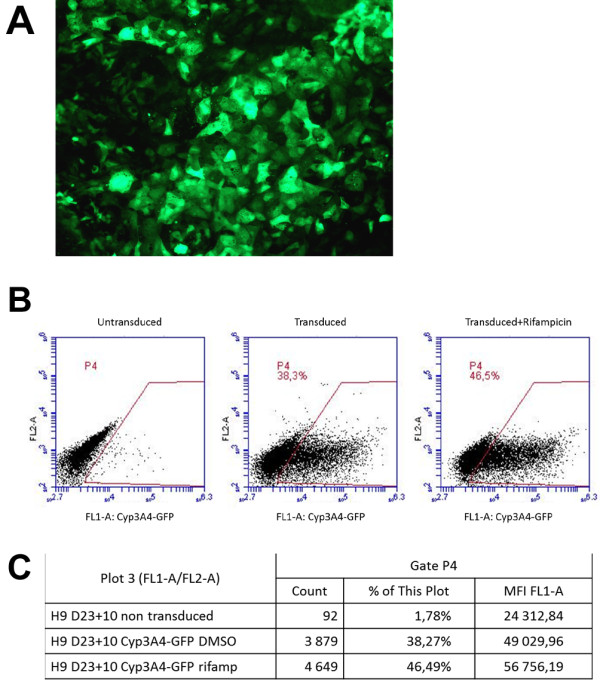
Figure 6.

Expression of green fluorescent protein (GFP) driven by the cytochrome P450 3A4 (CYP3A4) promoter in purified hepatocyte-like cells. (A) Fluorescence microscopy of GFP-expressing cells on day 33 after transduction (day 25 of differentiation; day 9 after sorting) by a lentivector expressing GFP under the control of CYP3A4 promoter. (B) Fluorescence-activated cell sorting (FACS) analysis of GFP expression on day 33 of differentiation from non-transduced cells and from cells transduced on day 25 and treated ont day 30 for 72 hours with vehicle (DMSO) alone or with rifampicin. (C) Quantification of analysis in gate P4 (B) by the CFlow software (Accuri Flow Cytometer; BD Biosciences, Le Pont-de-Claix, France).
