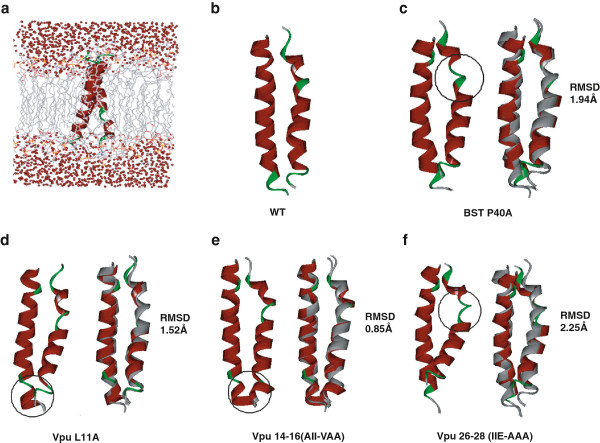
Figure 5.
Structures of BST-2/Vpu complex determined by molecular dynamics simulations. The representative structure was generated by cluster analysis, and the alignment of the mutant complexes (in ribbon, colored by secondary structure, helixes are in red, and turns or loops are in green) with the wild-type complex (gray ribbons) was conducted in DS (c-f). The significant conformational changes between the WT and mutants are highlighted by the black circles. (a) Description of the simulation model in membrane; (b) Representative structures of the complex of the wild type (WT) BST-TM and Vpu-TM; (c) Effect of the P40A mutation in BST2-TM on the BST-2 − Vpu interaction. (d) Effect of the L11A mutation in Vpu-TM on the BST-2 − Vpu interaction. (e) Effect of the 14–16 (AII to VAA) mutation in Vpu-TM on the BST-2 − Vpu interaction. (f) Effect of the 26–28 (IIE to AAA) mutation in Vpu-TM on the BST-2 − Vpu interaction.

