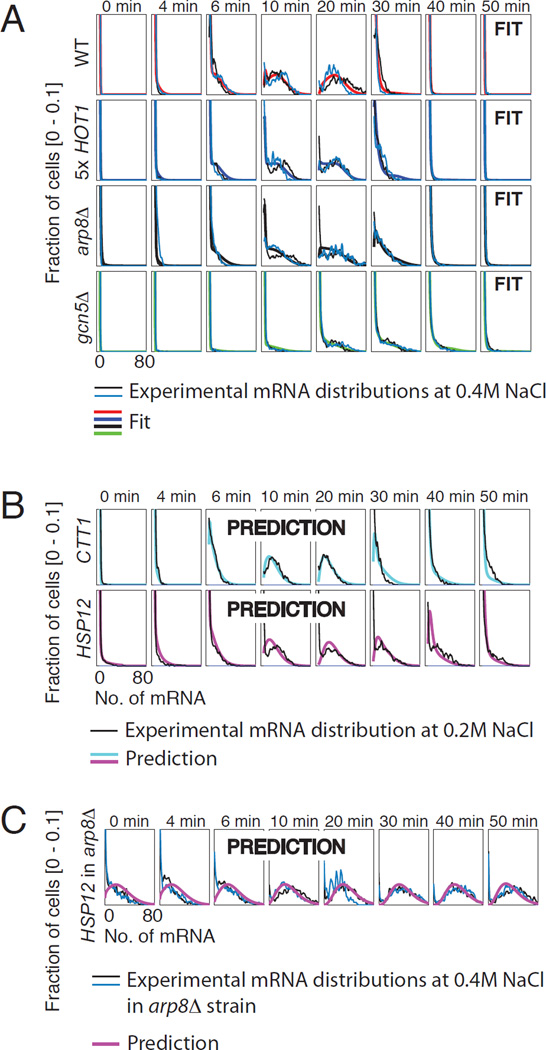
Fig. 3. Model structure validation.
A) Combined fit of the model structure identified (fig. S7) to different genetic mutations affecting STL1 expression at 0.4 M NaCl: WT (red), Hot1p 5x (blue), arp8Δ (black) and gcn5Δ (green). B) Model prediction of CTT1 (cyan) and HSP12 (magenta) expression at 0.2 M NaCl. C) Model prediction for HSP12 expression at 0.4 M in the arp8Δ strain.

