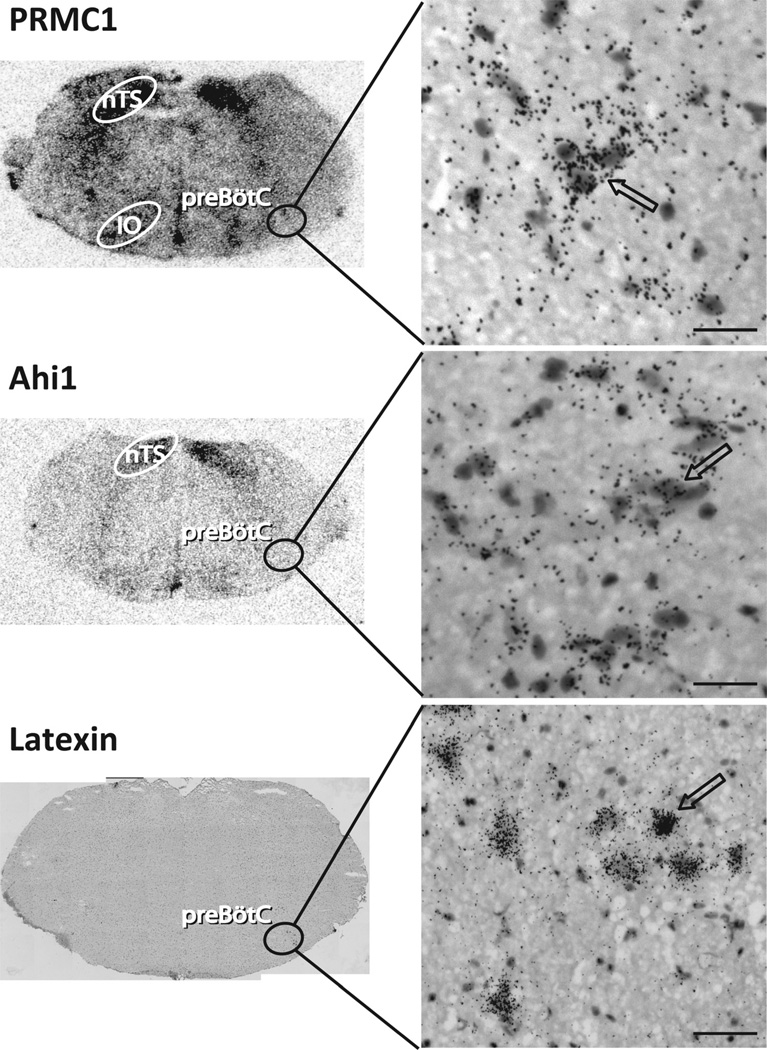
Figure 2.
Medullary expression pattern of PRMC1, Ahi1, and Latexin genes in pre-BötC using 35S-radiolabeled RNA probes in brightfield photomicrographs. Top: PRMC1 is highly expressed in nucleus of the solitary tract (nTS), inferior olive (IO), and pre-BötC. Middle: Ahi1 is highly expressed in nTS and in pre-BötC. Bottom: Latexin is expressed in rostral pre-BötC and BötC (not shown). Counterstain: hemotoxylin- eosin. Left: Low-magnification of transverse medullary slice; right: high-magnification depicting pre-BötC. The arrows indicate labeled neurons. Scale bars = 30 µm.

