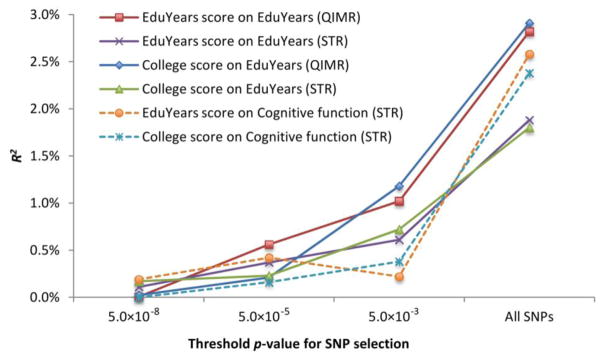
Fig. 2.

Solid lines show results from regressions of EduYears on linear polygenic scores in a set of unrelated individuals from the QIMR (N = 3526) and STR (N = 6770) cohorts. Dashed lines show results from regressions of Cognitive function on linear polygenic scores in a sample from STR (N = 1419). The scores are constructed from the meta-analysis for either EduYears or College, excluding the QIMR and STR cohorts.
