
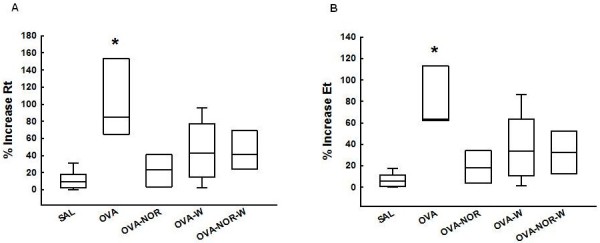
Figure 2.
“Box-plots” of the percentage of increase in tissue resistance (Rt%) (A) and elastance (Et%) of the five experimental groups (B). *p<0.001 compared to SAL, OVA-NOR, OVA-W, and OVA-NOR-W groups.
Official websites use .gov
A
.gov website belongs to an official
government organization in the United States.
Secure .gov websites use HTTPS
A lock (
) or https:// means you've safely
connected to the .gov website. Share sensitive
information only on official, secure websites.
“Box-plots” of the percentage of increase in tissue resistance (Rt%) (A) and elastance (Et%) of the five experimental groups (B). *p<0.001 compared to SAL, OVA-NOR, OVA-W, and OVA-NOR-W groups.