Figure 5.

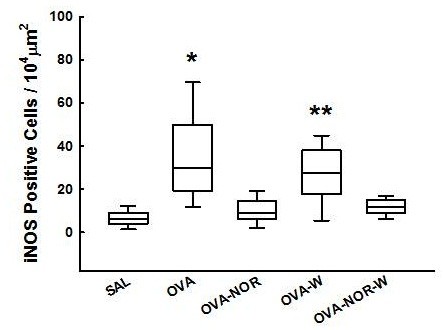
“Box-plots” of iNOS-positive cells in the alveolar septa of the five experimental groups. *p<0.001 compared to the SAL, OVA-NOR, and OVA-NOR-W groups. **p<0.001 compared to OVA-NOR-W group.

“Box-plots” of iNOS-positive cells in the alveolar septa of the five experimental groups. *p<0.001 compared to the SAL, OVA-NOR, and OVA-NOR-W groups. **p<0.001 compared to OVA-NOR-W group.