
Figure 6.
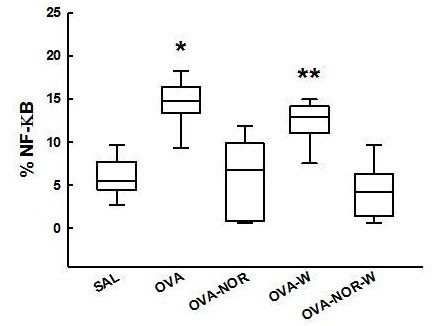
“Box-plots” of NF-kB expression (%) in the alveolar septa of the five experimental groups. *p<0.05 compared to SAL, OVA-NOR, OVA-W and OVA-NOR-W groups. **p<0.001 compared to SAL, OVA-NOR and OVA-NOR-W groups.
Official websites use .gov
A
.gov website belongs to an official
government organization in the United States.
Secure .gov websites use HTTPS
A lock (
) or https:// means you've safely
connected to the .gov website. Share sensitive
information only on official, secure websites.
“Box-plots” of NF-kB expression (%) in the alveolar septa of the five experimental groups. *p<0.05 compared to SAL, OVA-NOR, OVA-W and OVA-NOR-W groups. **p<0.001 compared to SAL, OVA-NOR and OVA-NOR-W groups.