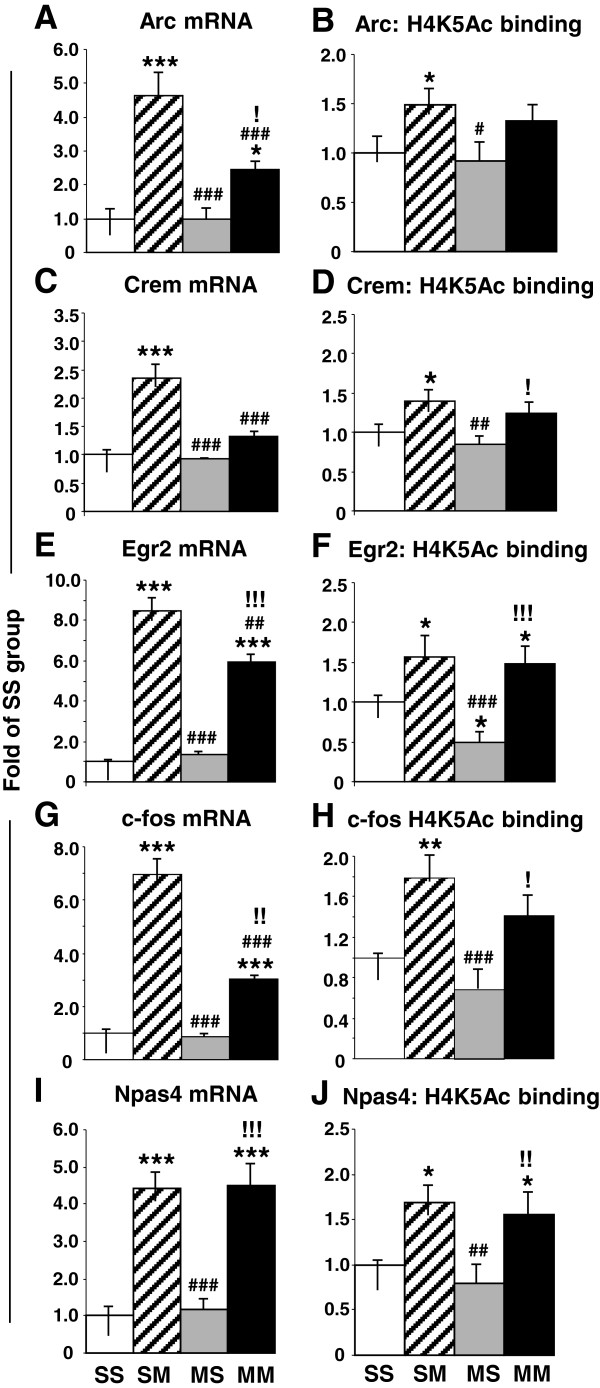
Figure 9.
Real-time PCR validation of the changes of expression and in H4K5Ac binding observed in genes of interest. Quantitative PCR shows that acute METH induced significant increases in the expression of (A) Arc, (C) Crem, (E) Egr2, (G) c-fos, and (I) Npas4 in saline pre-treated rats. Acute METH also caused smaller increases in (A) Arc, (E) Egr2, (G) c-fos, expression in METH-pretreated rats. In contrast, acute METH produced similar increases in (I) Npas4 expression in both saline- and METH-pretreated animals. The figure also shows the results of ChIP-PCR that revealed acute METH-induced increases in H4K5ac binding around the TSSs of (B) Arc, (D) Crem, (F) Egr2, (H) c-fos, and (J) Npas4 in saline-pretreated rats. METH-induced increased H4K5Ac binding in the METH-pretreated rats was observed only around the TSSs of (F) Egr2 and (J) Npas4. The data represent means ± SEM of 5–8 animals per group. Statistical analyses are described in the text. *, **, *** = p < 0.05, 0.001, 0.001, respectively, in comparison to the SS group; #, ##, ### = p < 0.05, 0.01, 0.001, respectively in comparison to the SM group; !, !!, !!! = p < 0.05, 0.01, 0.001, respectively in comparison to the MS group.

