Figure 6.
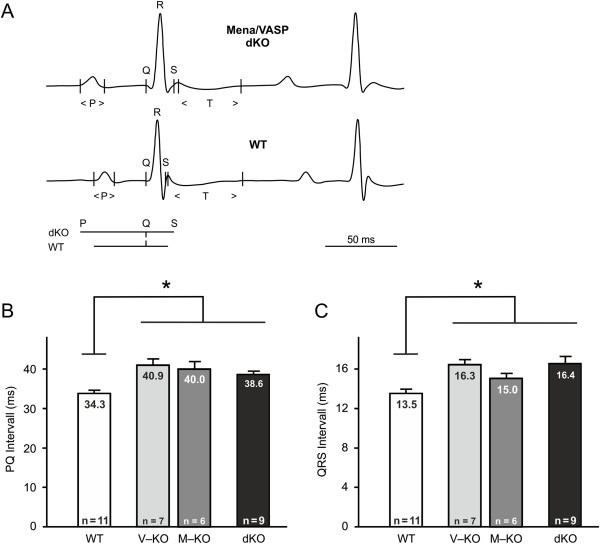
Mena/VASP double-deficiency results in conduction abnormalities. Electrocardiography (ECG). (A) Original, high resolution lead I ECG recording of a representative MenaGT/GTVASP−/− (dKO, upper panel) and wild-type (WT, lower panel) mouse. Q, R, and S spikes and the P- and T-waves are indicated. A comparison of the PQ and QRS intervals from dKO and WT mice is shown below the ECG recording of the WT. (B, C) Statistical analysis of the ECG recordings demonstrated significantly prolonged PQ (B) and QRS (C) intervals in VASP−/− (V-KO), MenaGT/GT (M-KO), and MenaGT/GTVASP−/− (dKO) mice. Bars represent the mean ± S.E.M, one-way analysis of variance (ANOVA), *P<0.05).

