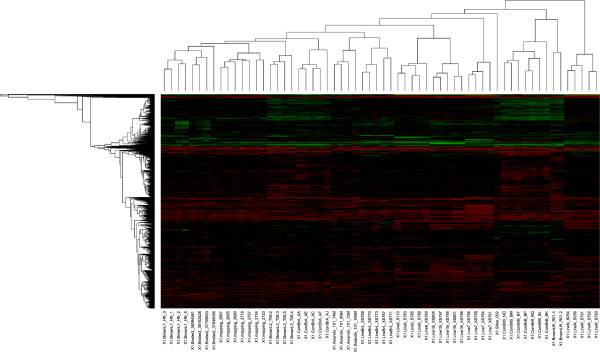
Figure 2.

Heatmap representation of copy number variation between chickens. Unsupervised clustering of CNVs with gains (green) and losses (red) yields a dendrogram that recapitulates features of the known genealogy of these animals within a line or breed.
