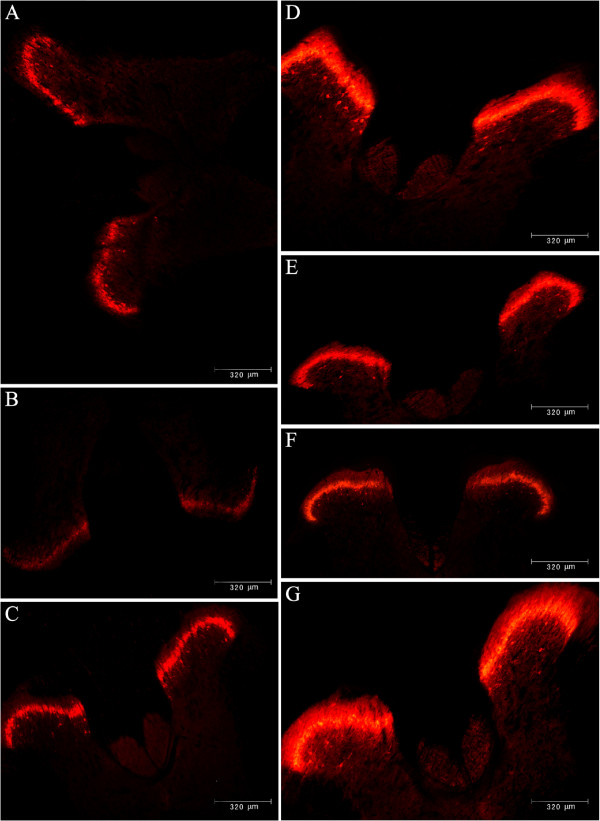
Figure 6.
PKCγ protein expression by immunofluorescence in the spinal level over time following exposure to single-prolonged stress. Representatives illustrating the distribution of PKCγ-immunoreactivity (IR) in the dorsal horn of control rats (A), and those day 1 (B), 7 (C), 14 (D) 21 (E), 28 (F), 9 (G) after exposure to SPS.

