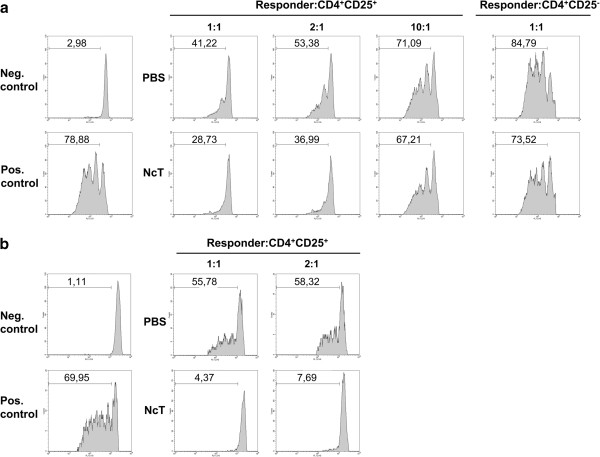
Figure 5.
High suppressive activity of Treg from N. caninum-infected mice. (a) Flow cytometric evaluation of anti-CD3 mAb (1 μg/mL) induced proliferative response of 2.5 × 10⁴ CFSE-labelled naïve CD4+CD25- T (responder) cells cultured for 72 h with 105 irradiated APC/well, in the absence (Pos. control) or presence of CD4+CD25+ T cells obtained from control mice or mice infected with N. caninum. Neg. control corresponds to responder cells with no mAb added. Histograms correspond to 1:1, 2:1 and 10:1 responder: CD4+CD25+ cell ratios or 1:1 responder: CD4+CD25- T cell ratio, as indicated. (b) Flow cytometric evaluation of N. caninum antigen-induced proliferative response of 2.5 × 10⁴ CFSE-labelled splenic CD4+CD25- T (responder) cells obtained from 7 day-infected mice, cultured for 72 h with 105 antigen-loaded BMDC/well, in the absence (Pos. control) or presence of CD4+CD25+ T cells obtained from control mice or mice infected with N. caninum. Non-specific proliferation control (Neg. control) corresponds to responder cells cultured with LPS (50 ng/mL) activated BMDC, without N. caninum antigen. Histograms correspond to 1:1 and 2:1 responder: CD4+CD25+ cell ratios, as indicated. Numbers within histograms correspond to the percentages of cells that divided at least once. CD4+CD25+ cells added in each condition were sorted from pooled splenic cells of 5 mice per group. Results are a representative example out of three (a) or one out of two (b) independent experiments.

