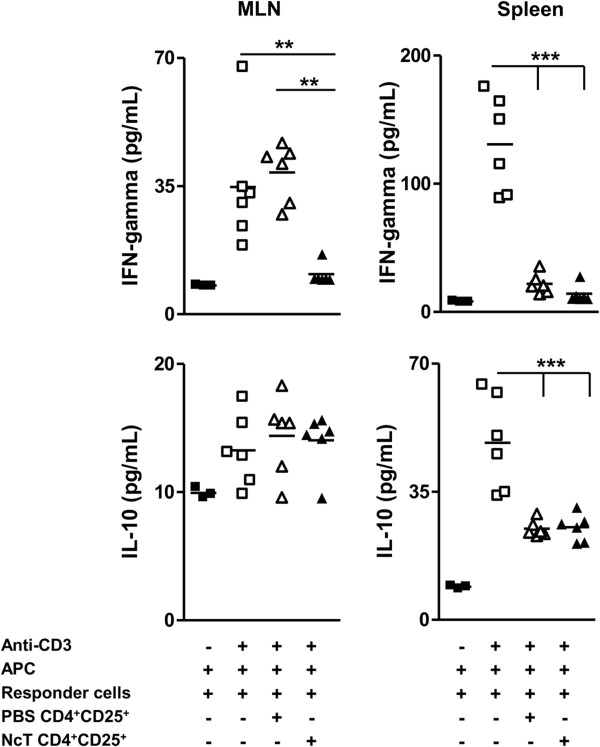
Figure 6.
Suppression of cytokine production by splenic and MLN Treg. IFN-γ and IL-10 cytokine concentration in the supernatants of MLN or splenic naïve 2.5 × 10⁴ CD4+CD25- T cells cultured for 72 h with anti-CD3 mAb (1 μg/mL) and 105 APC, alone or in the presence of 1:1 CD4+CD25+ MLN or splenic T cells from control or N. caninum-infected mice, as indicated. Each symbol represents an individual culture well. Horizontal bars represent the mean values of the respective group. CD4+CD25+ cells added in each condition were sorted from pooled MLN or splenic cells of 5 mice per group, as indicated. Results are a representative example out of three independent experiments. Statistical significance among groups was determined by one-way ANOVA, followed by a Bonferroni post-test, and is indicated above symbols (**P<0.01; ***P<0.001).

