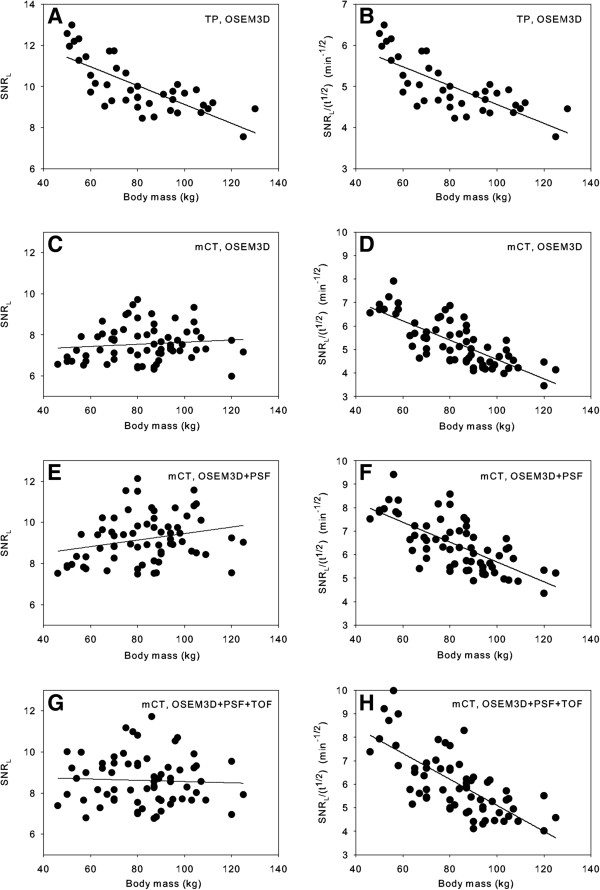
Figure 2.
SNRL and SNRL/(t1/2) versus body mass. Signal-to-noise ratio in the liver (SNRL) versus body mass (left) and SNRL normalized to an acquisition time per bed position of 1 min versus body mass (right) for the Biograph TruePoint (TP), OSEM3D reconstruction (A, B) and the Biograph mCT for three different reconstructions: (C, D) OSEM3D, (E, F) OSEM3D + PSF, and (G, H) OSEM3D + PSF + TOF. The lines in the graphs are the result of linear regression of the data.

