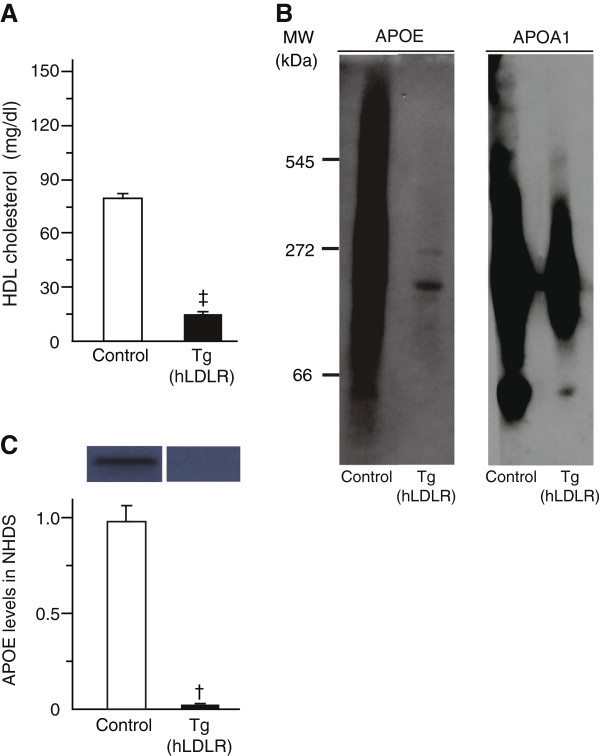
Figure 3.
HDL cholesterol concentrations in serum, APOE and APOA1 levels in HDL subfractions in control and Tg(hLDLR) mice. Serum and NHDS were obtained from serum of 8-week-old males (n = 5 per genotype). HDL cholesterol concentration was measured in control and Tg(hLDLR) mice (A). HDL subfractions were electrophoresed in a non-denaturing gel and blotted using antibodies for APOE and APOA1 (B). Fifteen μg of proteins of NHDS were separated by SDS-PAGE and blotted using an APOE antibody. The relative band intensity of APOE is shown (C). Data represent the mean ± SEM. †P < 0.001.

